The group of Daniel Müller (Web Site) uses single-cell force spectroscopy extensively. This is a technique to measure the force between two living cells by using an atomic force microscope (AFM). A single cell is placed on the tip of an AFM. The tip, together with the cell, is moved in a controlled fashion towards another cell attached to a substrate. After both cells are in contact, the tip is withdrawn from the substrate. During removal the cells will stick together, and the forces occurring during unbinding need to be analyzed.
When we were approached by the Müller group for assistance, the group analyzed their measurements by hand, and it would take them up to one hour to analyze one curve. This process did not scale to the number of experiments that the group needed to perform to answer their research questions. Closely working with the group's experts in single-cell force spectroscopy curves, we developed an algorithm to analyze force curves. The resulting software, the Single Cell Force Spectroscopy Analyzer, automatically analyzes measurements, reducing the analysis time to less than 2 seconds per analysis.
The software runs in batch mode, accepting configuration parameters for the run in the GUI and allows analyzis of hundreds or thousands of curves easily. It outputs a CSV file that summarizes the details of the run, including a quality indicator for the reliability of each curve's fit, and, for each curve, it provides a plot that explains how the fit result was derived.
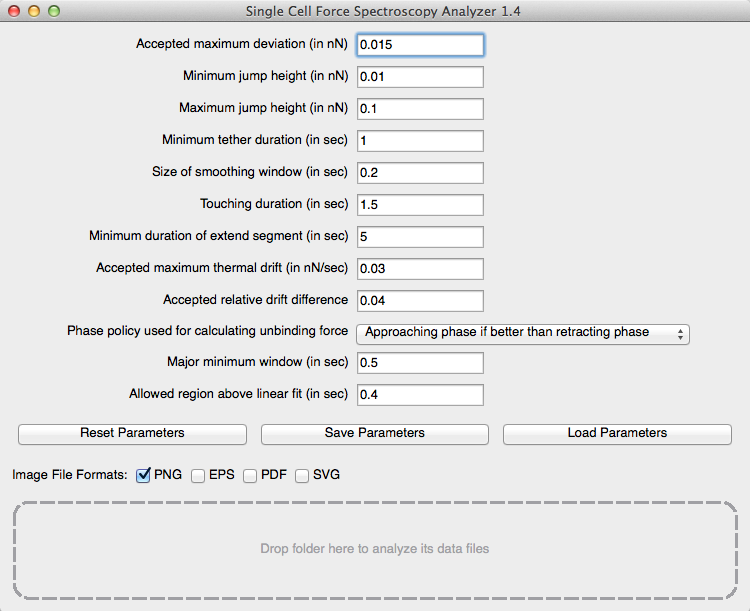
GUI for providing configuration parameters.
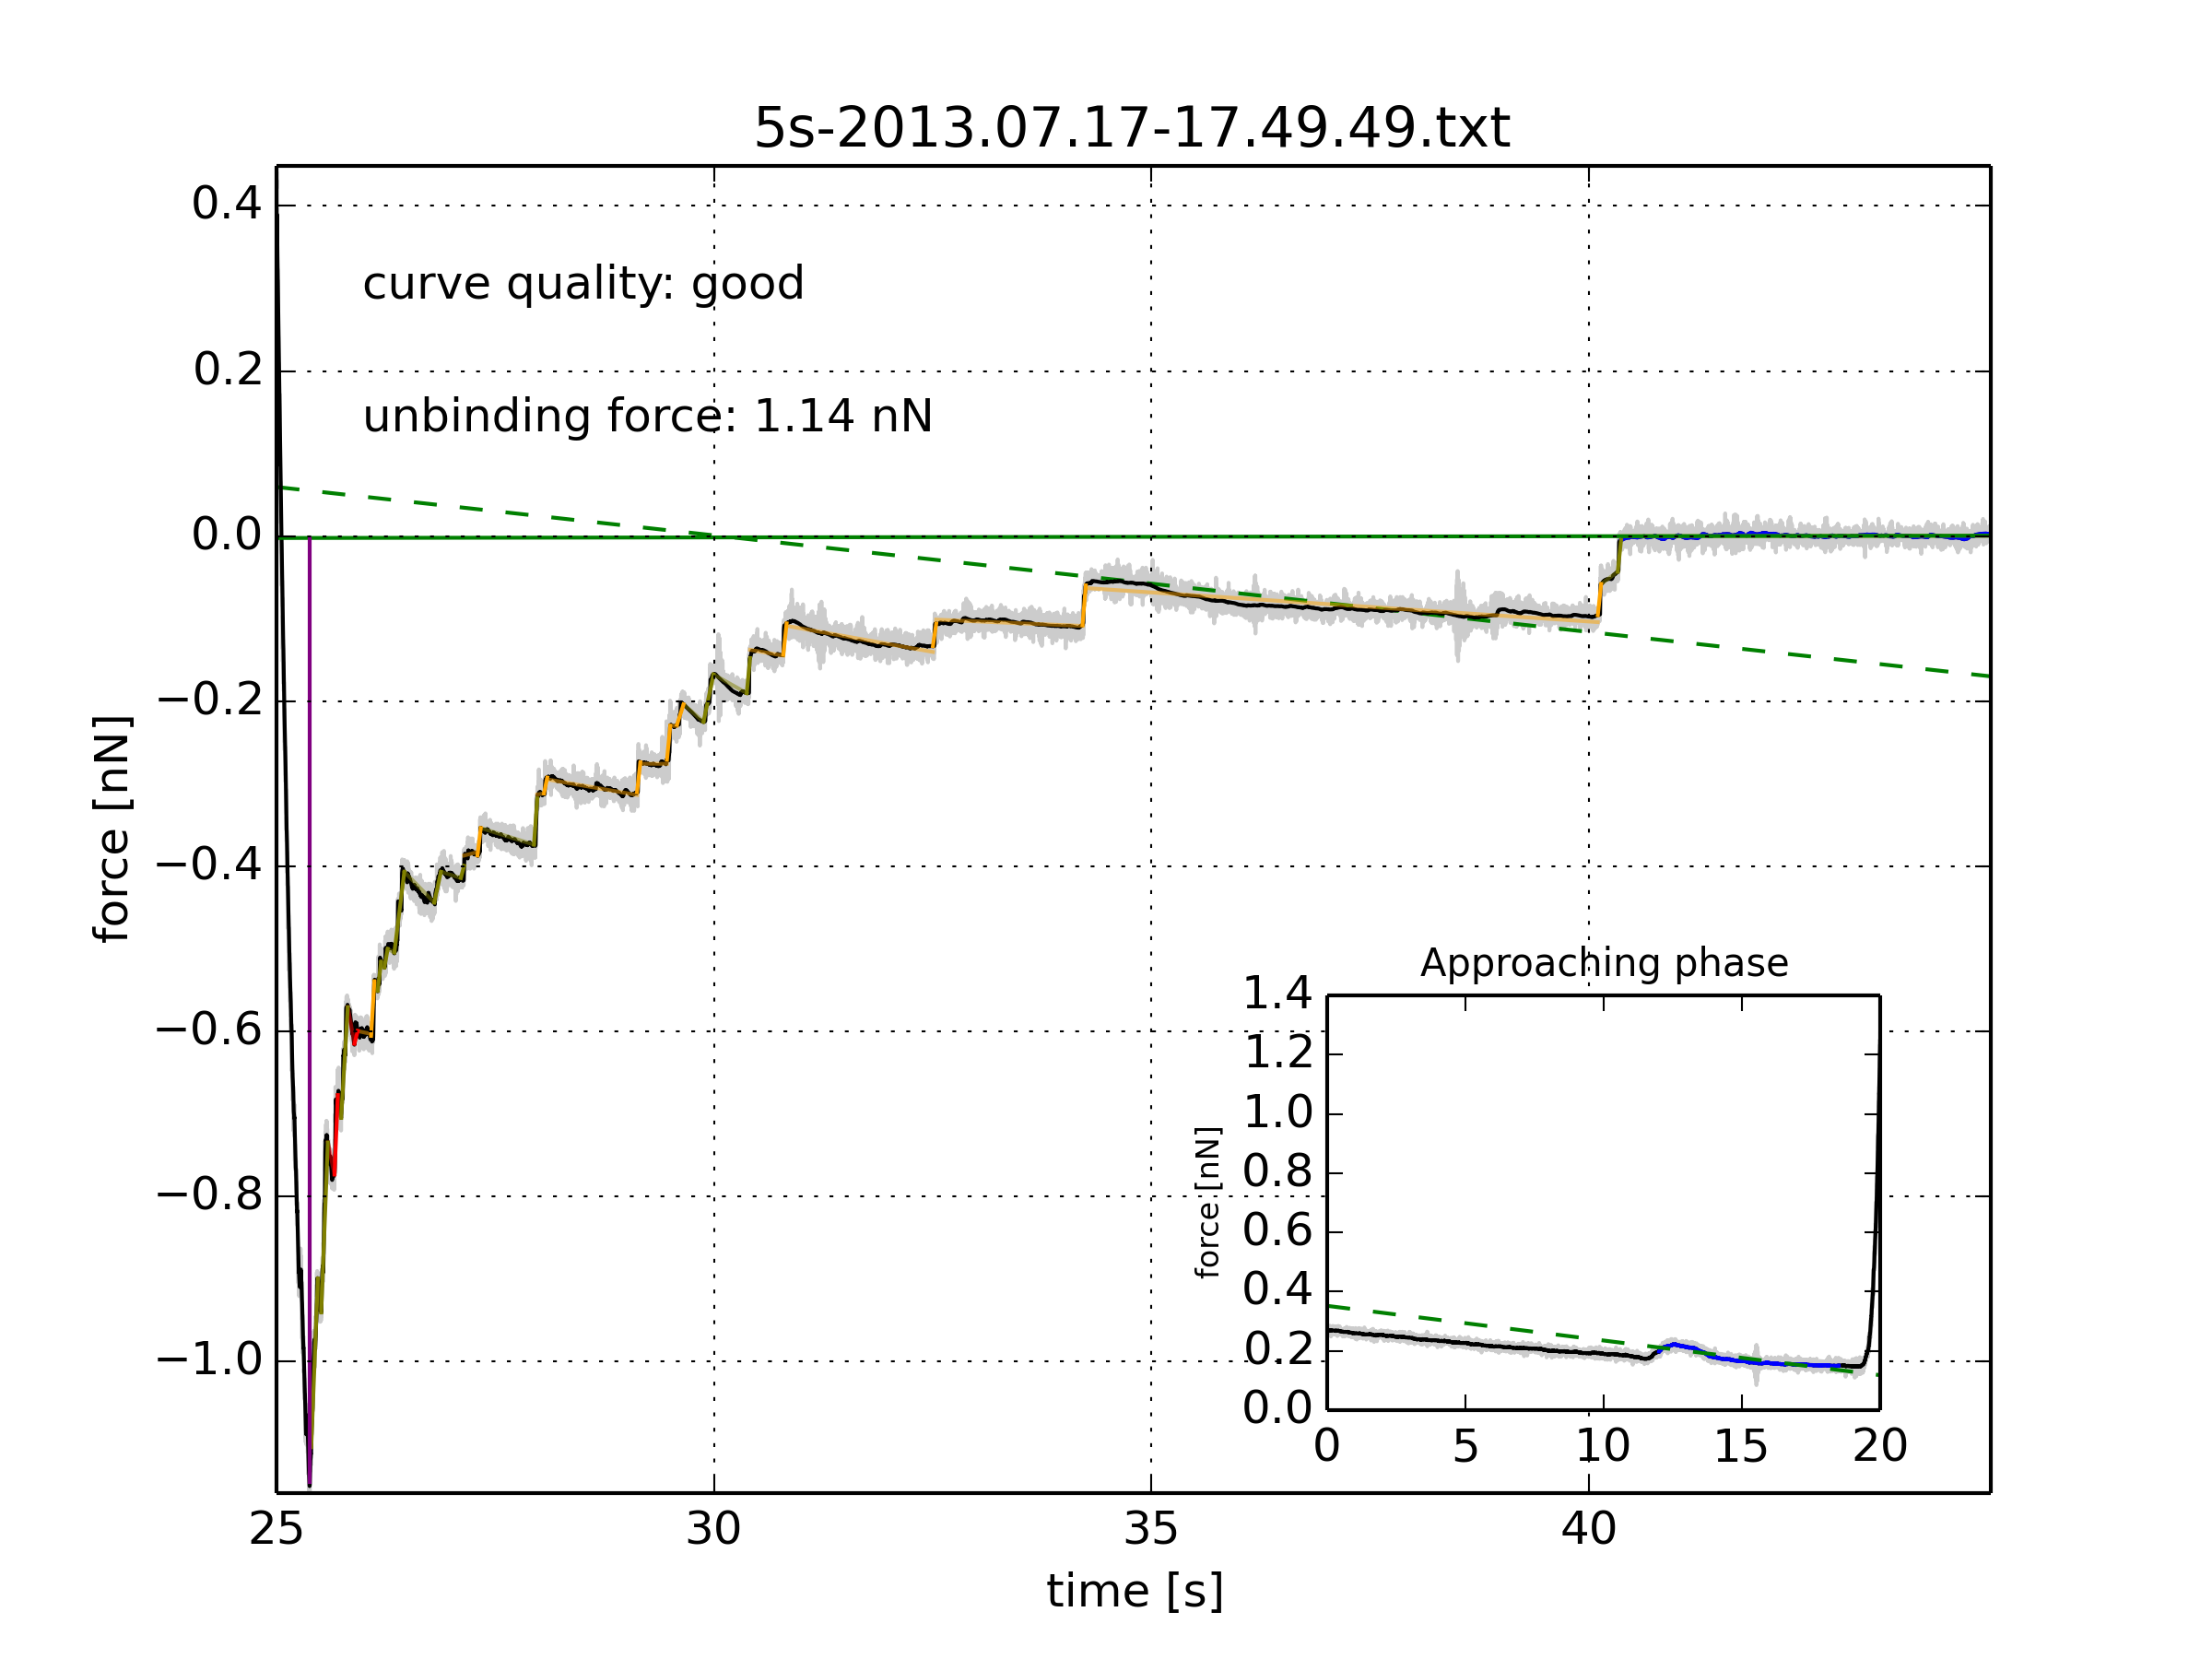
Image explaining analysis result.